Stats Dashboard
Navigate to Stats (accessible from the header or /admin/stats) to see aggregated deployment metrics.
Figures are cached for up to 30 seconds per project/time-span combination, so a just-completed change (a lab finishing, a workspace being created or cleaned) may take up to 30 seconds to appear here.
Project selector
Use the Select a Project dropdown to scope the view to a single lab stack name, or choose All Projects for a combined view. The two views show different figures:
- A single project — a lab stack has exactly one outcome (it succeeded, failed, or was destroyed), so lab-level counts aren't useful there. The page shows workspace-only figures for that lab instead.
- All Projects — figures combine both lab-level and workspace-level counts across every tracked lab.
Time span selector
Use the Time Span dropdown next to the project selector to limit the KPI cards and activity chart to a trailing window: Last 7 days, Last month, Last 3 months, Last 6 months, Last year, or All time (default). Last 7 days and Last month plot one point per day; longer windows (and All time) plot one point per month. Historical data from a deleted lab (see below) is only preserved at month granularity, so under a daily view it's attributed to the 1st of its month. The Per-project breakdown table always shows all-time totals regardless of the selected time span.

KPI cards
Four summary cards are shown at the top of the page:
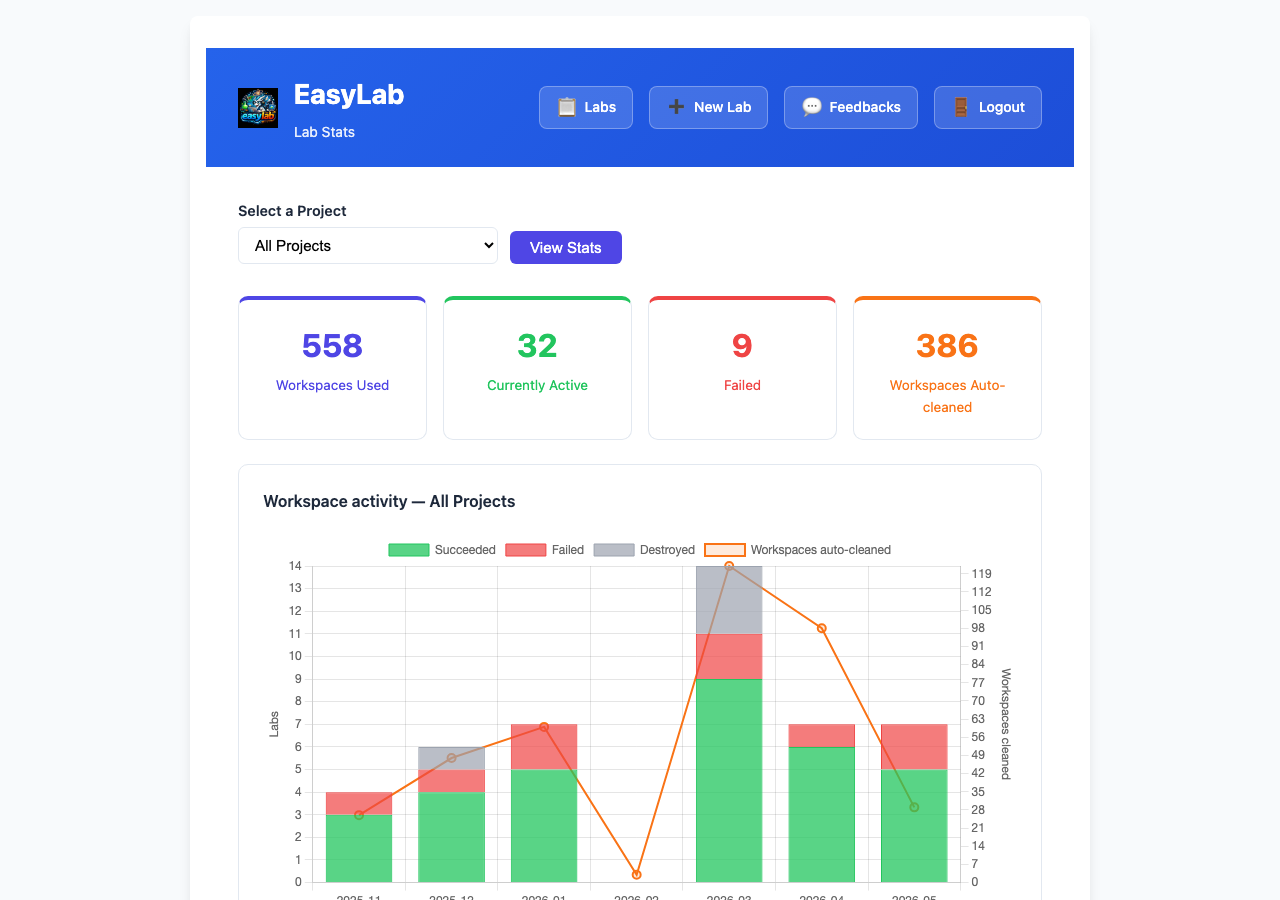
All four cards are scoped to the selected Time Span (see above) in addition to the selected project.
| Card | All Projects | Single project |
|---|---|---|
| Workspaces Used | Total workspaces created within the selected time span, across all tracked jobs, whether or not a lab has an auto-expiry lifetime configured | Same, scoped to this lab |
| Currently Active | Number of completed (live) labs created within the selected time span | Renamed Active Workspaces: workspaces created minus workspaces cleaned for this lab, within the selected time span |
| Failed | Number of labs that ended in a failed state within the selected time span | Hidden (not meaningful for a single lab) |
| Workspaces Cleaned | Count of workspaces deleted within the selected time span, whether automatically by the cleanup service or manually by an admin/student | Same, scoped to this lab |
Figures are preserved even after an old destroyed or failed lab is removed from the admin list — deleting a lab drops it from the labs list, but its historical contribution to these KPIs and to the activity chart below remains.
Activity chart
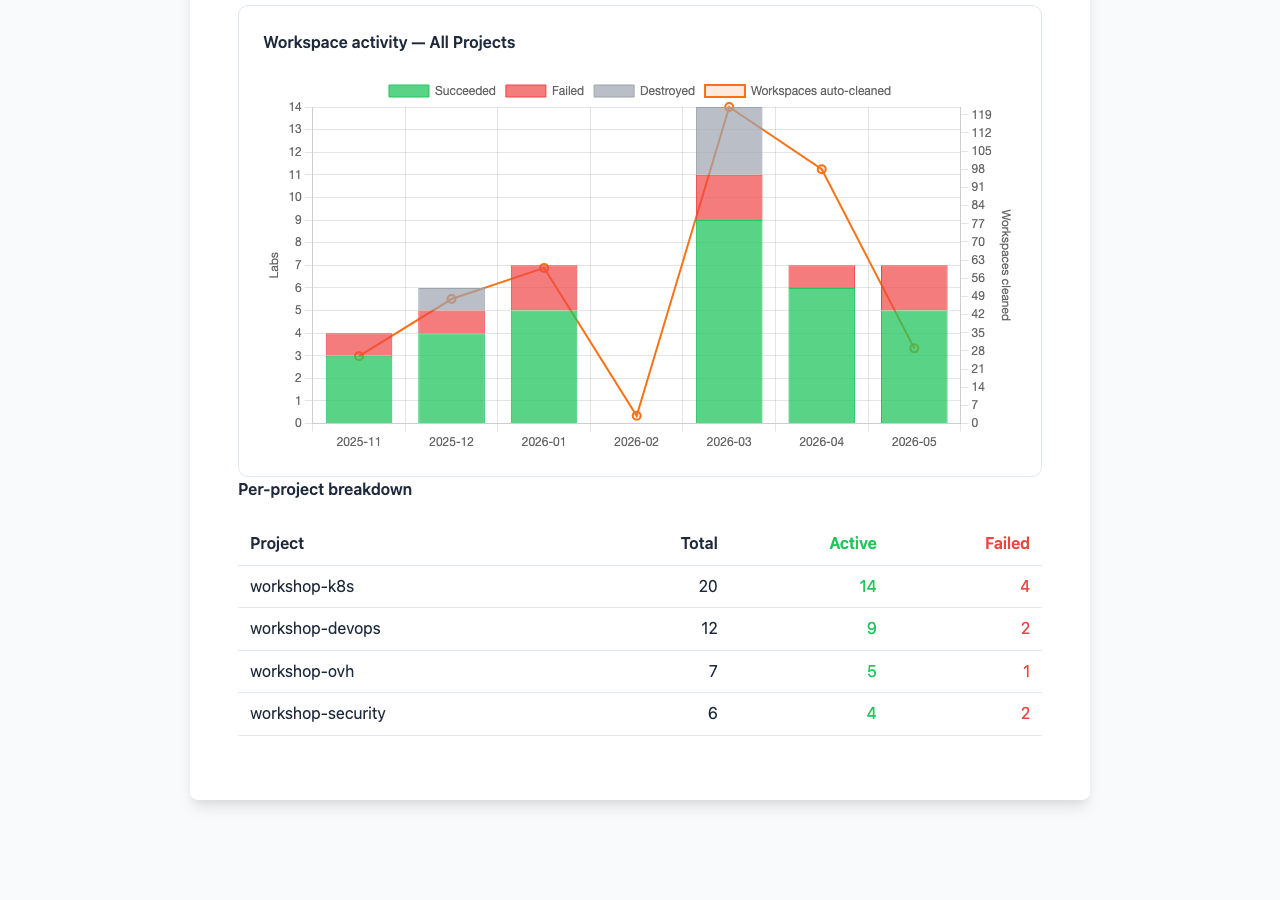
- All Projects: four lines — Labs (labs succeeded, failed, or destroyed in that data point's period, left axis) plus three workspace lines on the right axis: Workspaces Total (created in that period), Workspaces Active (a running total: workspaces created so far minus workspaces cleaned so far, i.e. how many were alive as of that point), and Workspaces Cleaned (cleaned in that period). A destroyed lab is counted against the period it was destroyed in, not the period it was created in. The period is a day or a month depending on the selected time span — see above.
- Single project: two lines, both on the same axis — Workspaces created and Workspaces cleaned for that lab.
Per-project breakdown
When All Projects is selected, a summary table is shown below the chart listing each project with its total, active, and failed lab counts.